The secondary battery1 value chain2 is the chain of industries that turns minerals into electric vehicles and energy storage. Split it into four layers and it fits on one map.
- The value chain is easy to see once you split it into four layers: materials, equipment, cells3, and packs and ESS4.
- The single biggest item in cell production cost is the cathode active material5: 40–50% for NMC6 batteries and 25–30% for LFP batteries (IEA).
- In a cell factory, the process with the largest equipment investment is formation7, the first charge (PEM·VDMA).
- A new factory does not reach its nameplate output right away. Scrap rates8 of 15–30% are common in the first few years (Fraunhofer FFB).
In one sentence
Make the materials, build the machines, make the cells, then bundle and sell them.
The battery industry works like a relay race, with layers of companies running different legs. Materials companies make powders and thin films, and equipment companies build the machines that process them. Cell makers turn those materials and machines into cells. Once you know who does what, you can tell which layer a news story is about.
The last layer bundles many cells into packs or ESS. Packs go into electric vehicles, and ESS go into places that store electricity, such as power grids and data centres. In 2025, electric vehicles accounted for more than 70% of all battery use (IEA). Link the four layers in order and you have the value chain.
Picture a street of bakeries. A flour mill (materials), an oven maker (equipment), a bakery (cells) and a gift-box shop (packs and ESS) stand in a row. If the flour stops, the bakery stops, and when the bakery stops, so do the gift boxes.
Where the analogy breaks: bread is eaten within days, but batteries last. The IEA expects most batteries installed in EVs and ESS over the past few years to stay in use until the mid-2030s. And unlike a bakery that can open with one oven, a cell factory only runs when a different machine for each process is lined up in a row.
On this map, the author stands on the second layer: equipment. Equipment makers do not sell cells. Instead, their machines decide in advance how thin and how fast cells can be made. That is why this series walks through the factory through the eyes of someone who builds the machines.
In pictures
Materials flow to the right; machines hold the line up from below.
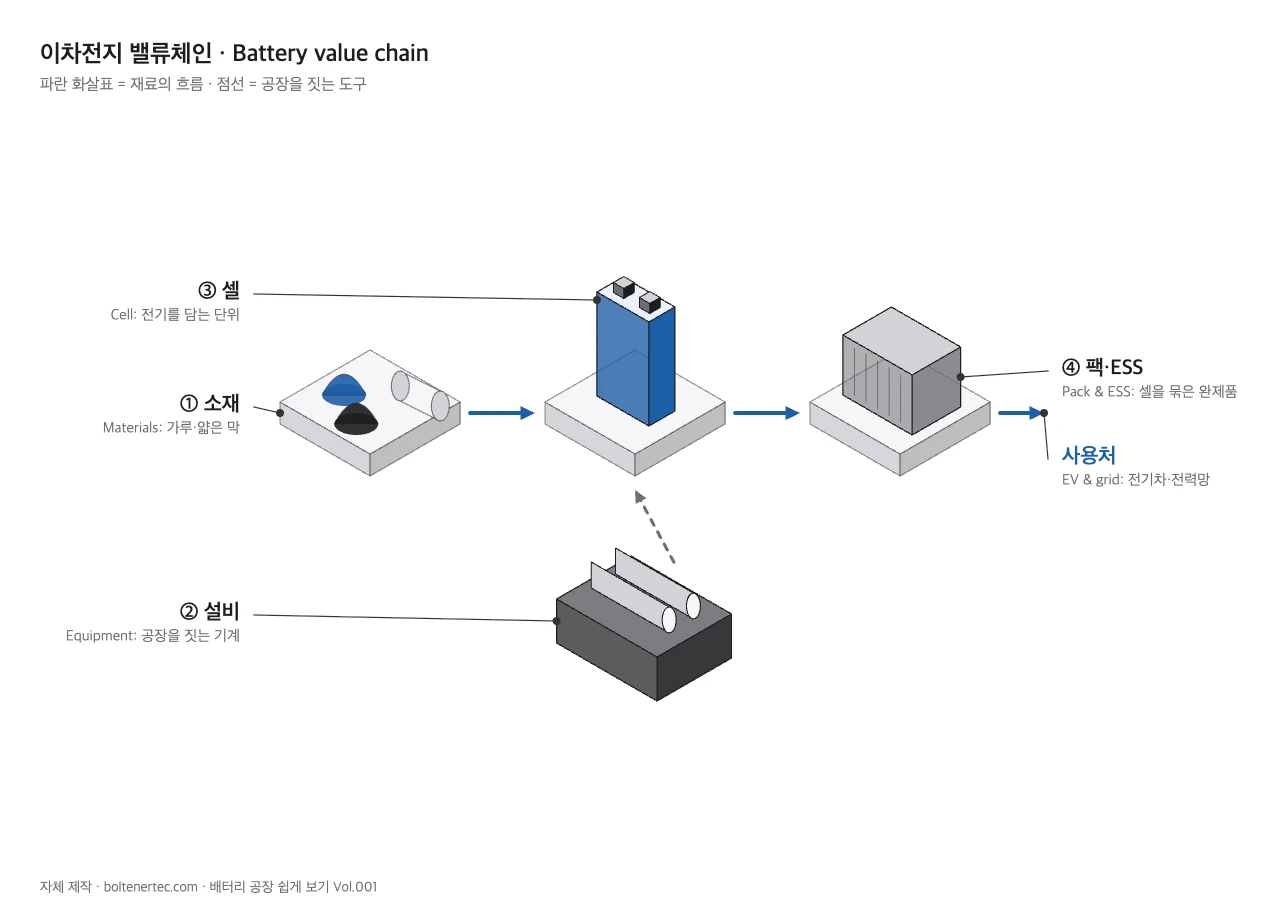
- MaterialsTurn minerals into powders and thin films. This layer makes what goes into a cell.
- CellsFeed materials into machines to make cells: electrodes, assembly, then the first charge.
- Packs & ESSBundle many cells into EV packs or energy storage systems.
Equipment sits outside this line. It does not stand on the path the materials travel; it builds the place where the cell factory stands. Equipment orders come when a cell factory is built or a line is added, while materials orders keep coming as long as the factory runs. The oven maker is busy when a bakery opens; the flour mill is busy every day the bakery is open.
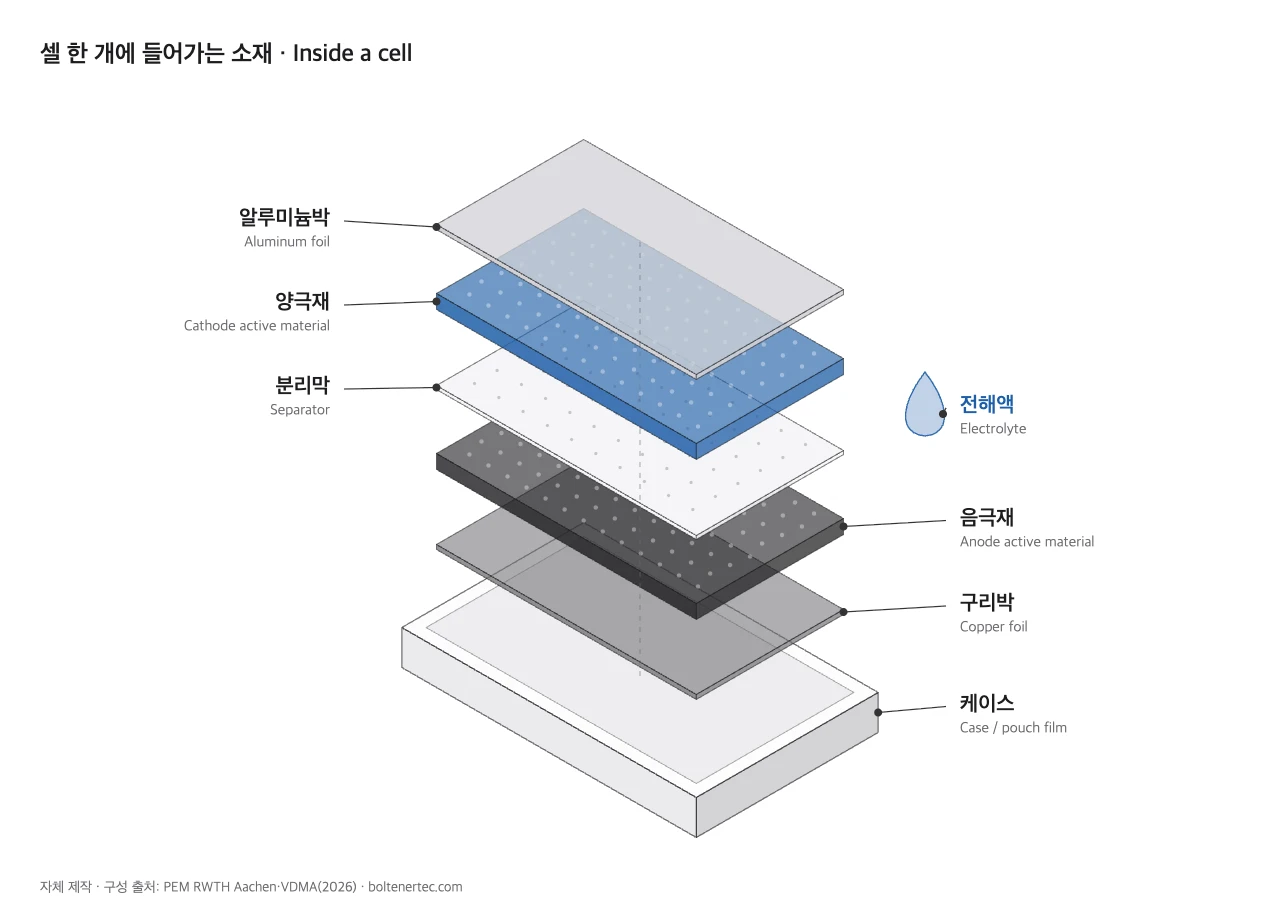
Take one cell apart and you find every product of the materials layer. The positive electrode is aluminium foil coated with cathode material, and the negative electrode is copper foil coated with anode material. Both are made by spreading a thin layer of powder paste on both sides of the foil and drying it (PEM·VDMA). The foil becomes the path the electricity travels.
A separator keeps the two electrodes apart, and electrolyte fills the gaps. Korean industry groups these four as the “four key materials”9. Put the bundle in a case and seal it, and you have a cell. Cells come in three shapes: cylindrical, pouch and prismatic (IEA).
In numbers
Three numbers show the size of the industry and where it is concentrated.
1.2 TWh is a large number. A TWh10 (terawatt-hour) is a unit for amounts of electricity. It is more than seven times the 2020 level and almost 30% up on 2024 (IEA). Converted into average European electric car batteries (about 70 kWh), it is roughly 17 million cars’ worth (simple conversion; the total includes trucks and buses).
The second number is about where the money goes. For NMC batteries, 40–50% of the cost of making a cell comes from cathode material alone. For LFP batteries, cathode material is still the largest share, at 25–30% (IEA). For NMC, a single powder decides almost half the value of a cell.
The third number is about location. At the end of 2025, more than 80% of the world’s lithium-ion battery manufacturing capacity was in China. The European Union and the United States each held 6–7% (IEA). Split capacity into ten parts and more than eight sit in one country.
| Layer | What it makes | Bakery analogy | Key number |
|---|---|---|---|
| Materials | Cathode, anode, separator, electrolyte, metal foils | Flour mill | Cathode = 40–50% of NMC cell production cost (IEA) |
| Equipment | Mixers, coaters, roll presses, assembly machines, formation systems | Oven maker | About €280–505 million of equipment for a 10 GWh cell plant (sum of PEM·VDMA per-process ranges) |
| Cells | Cells that have gone through electrode making, assembly and first charge | Bakery | 1.2 TWh for EVs in 2025 (IEA) |
| Packs & ESS | EV packs, energy storage systems | Gift-box shop | EVs were more than 70% of battery use in 2025 (IEA) |
The equipment figure in the table is the author’s sum of the per-process investment ranges. It covers machinery and equipment only, not buildings. PEM·VDMA based these ranges on a factory making 10 GWh a year, about 30 million pouch cells. The next section breaks them down by process.
On the factory map
Mixing → Coating → Calendering → Slitting → Assembly → Formation → Logistics
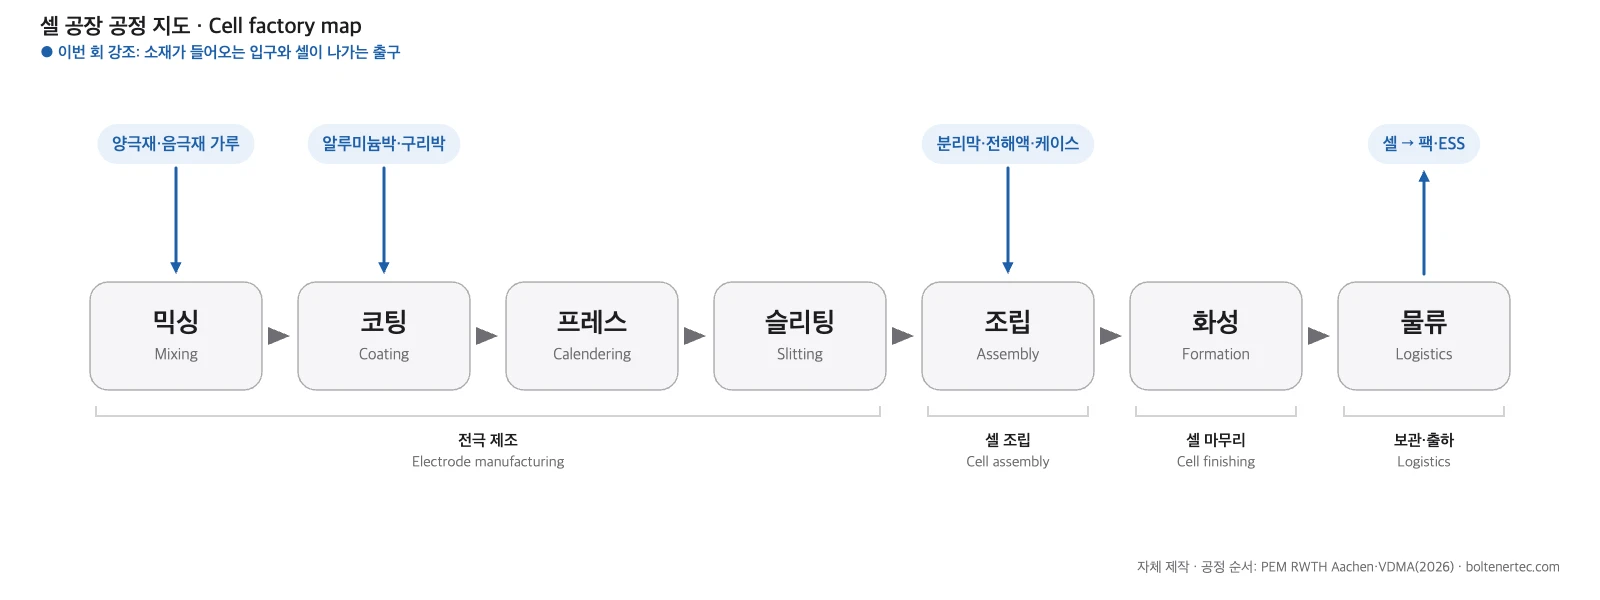
A cell factory has three main zones: one makes electrodes, one assembles cells, and one finishes cells with the first charge and testing (PEM·VDMA). Materials enter through different doors. Powders go to mixing, foils go to coating, and separators and electrolyte go to assembly.
The map only flows one way. The guide from the PEM chair at RWTH Aachen University and the German Engineering Federation (VDMA) notes that foreign particles in the coating cannot be removed by cleaning later in the process. That is why electrode production takes place in clean rooms. A flaw created early is hard to undo downstream.
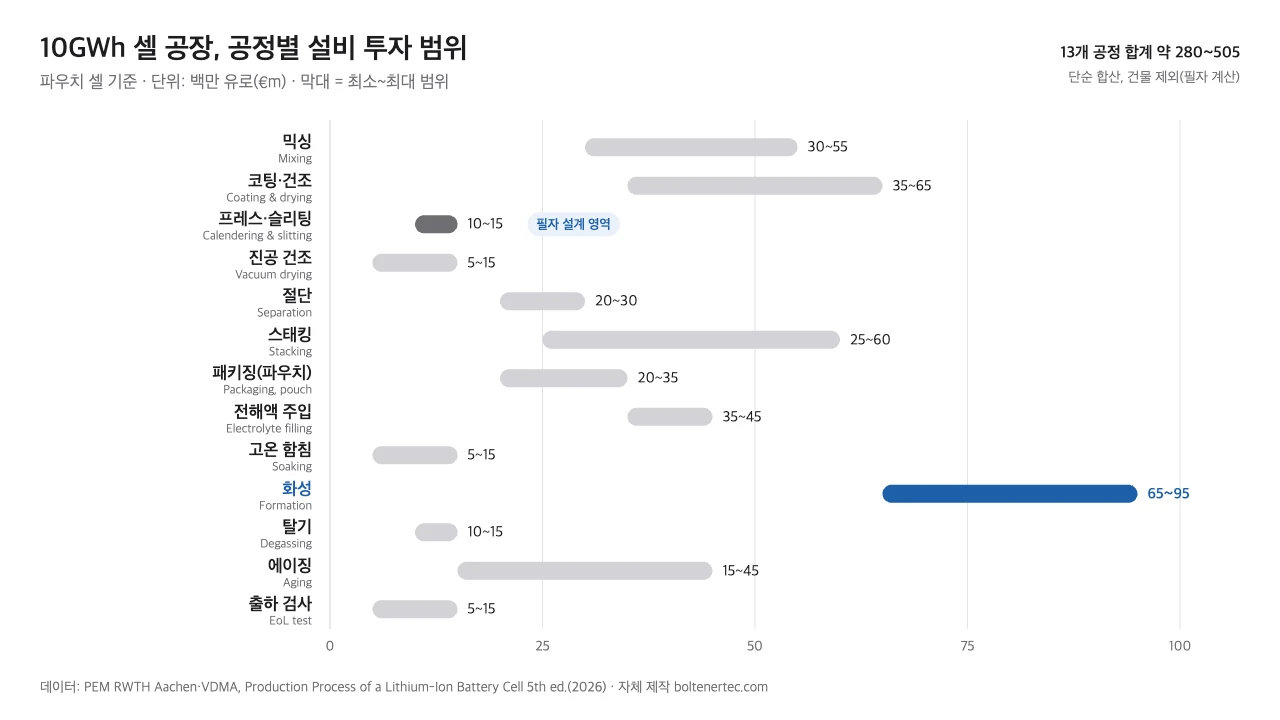
Machine costs differ by process too. Each bar in Figure 4 is the investment range for one process. The bar furthest to the right is formation. At €65–95 million, it is larger than stacking, which piles electrode sheets one by one (€25–60 million) (PEM·VDMA).
The author sees the reason in time. A cell sits on a charging rack for up to 15 hours, and this factory makes about 30 million cells a year (PEM·VDMA). The more cells wait on racks, the more racks you need. Formation conditions also differ from one cell maker to another, and formation is seen as a cell maker’s core know-how (PEM·VDMA).
Adding up the ranges of all thirteen processes gives about €280–505 million (simple sum, pouch cells). Formation alone accounts for roughly one-fifth of that. The biggest room on the factory map is not the assembly robots but the charging racks.
Through a designer’s eyes
The author has designed roll-to-roll11 equipment since 2005. The main ground is the roll press, which squeezes electrodes flat, the slitter, which cuts them into long strips, and the rolls turning inside them. Variable Crown Rolls, which change the bulge at the centre of a roll with hydraulic pressure during operation, are also part of the design work.
Equipment does not enter a factory on the strength of a purchase order. It ships only after design, fabrication and a passed FAT12 (Factory Acceptance Test). The author’s design team runs this sequence in eight-month cycles. For a designer, news of a factory expansion is not a result but the start of a schedule.
— Boltenertec, R2R equipment designer since 2005
Find the author’s cell in Figure 4 and it is calendering and slitting. Its investment range is €10–15 million, one of the smaller ones (PEM·VDMA). Yet this cell decides the thickness and width of the electrode. The same source gives a slitting width tolerance of ±150 to ±250 µm, that is, ±0.15 to ±0.25 mm.
In the PEM·VDMA process sequence, no step after calendering sets the electrode thickness again. An error born in this small cell follows the product all the way to formation and final testing. When a roll sags in the middle under pressing force, the sag stays as a thickness difference across the width. That is why the author checks roll stiffness and assembly error before equipment price.
A common misconception
Once a factory is built, it makes cells at its nameplate rate from the next day.
Scrap rates of 15–30% are common in the first few years of a new cell factory, and around 10% even after five years (Fraunhofer FFB).
It is like the kitchen of a newly opened restaurant. In the first weeks, food comes out slowly and many plates are sent back. Speed comes, and returns fall, once the team works in sync.
Where the analogy breaks: a restaurant gets in sync within weeks, but a cell factory ramps up over years. A rejected cell cannot be reheated; it goes to recycling as feedstock. The IEA notes that battery recycling today relies mainly on this kind of production scrap.
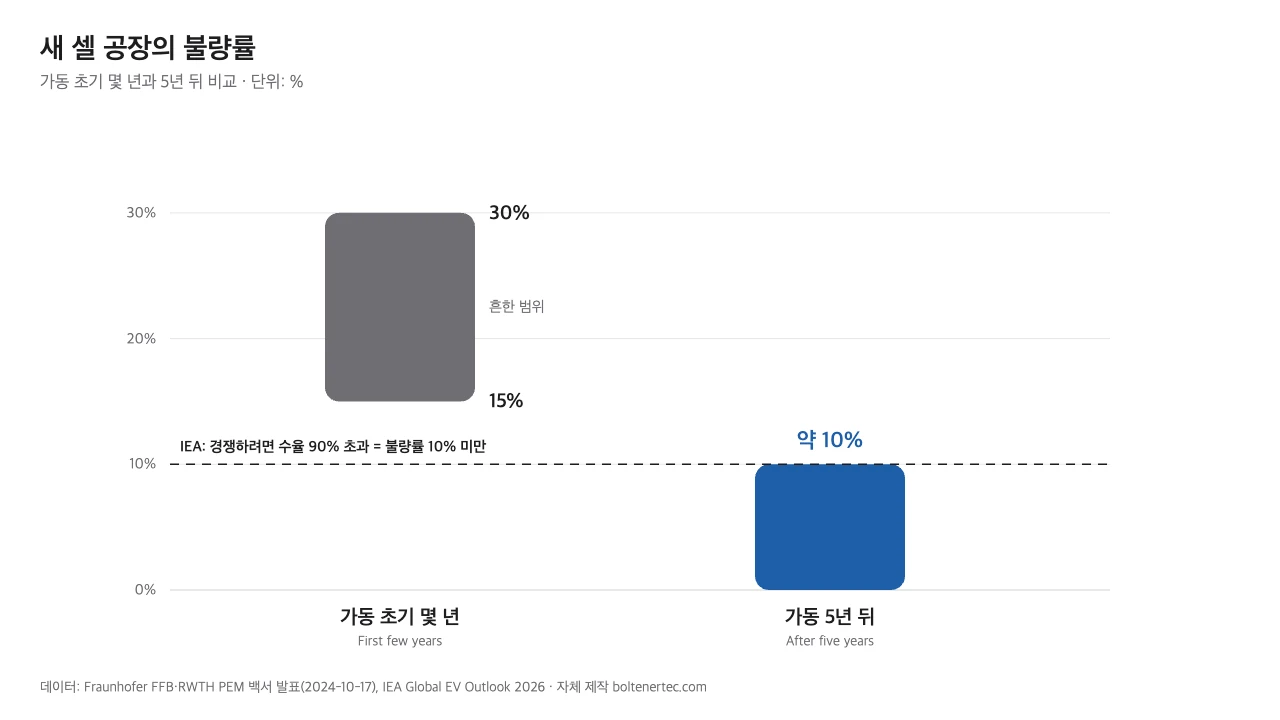
The number on a factory’s nameplate is its nameplate capacity13: the maximum when every machine runs as planned. The period from start-up until output approaches that number is called ramp-up14. The GWh figures in factory announcements are usually nameplate capacity.
The IEA says that for most facilities it can take more than five years from the start of operations to reach levels close to nominal output. The IEA also judges that competing requires average production yields above 90%. A scrap rate of about 10% after five years only just reaches that threshold.
Why does it take so long? Germany’s Fraunhofer Research Institution for Battery Cell Production (FFB) points to two things. One is product and process uncertainty; the other is a lack of skilled workers who can handle the complexity of cell production. The IEA adds that having specialised staff and equipment makers nearby to troubleshoot quickly also shapes the pace.
What it means for you
Each layer works with different things. In mechanical design on the equipment layer, the author draws with AutoCAD, Autodesk Inventor and MechClick. Repetitive work is cut down with AutoLISP scripts, and calculation tools are built in Python (PySide6, Tkinter).
When the news mentions GWh, convert it into a number of electric cars. Dividing 1 GWh by an average European car battery of about 70 kWh gives roughly 14,000 cars (simple conversion). Once the number feels concrete, the article gets easier.
Sort the news into “building stories” and “running stories”. Groundbreakings and expansions reach the equipment layer first. Operations and shipments reach the materials layer after that. Telling nameplate capacity from actual output is part of the same habit.
One step further for engineers
The link between nameplate capacity and good output fits in one multiplication.
$$E_{good} = E_{nom} \times U \times (1 – s)$$
$E_{nom}$ is nameplate capacity (GWh/year) and $E_{good}$ is good output (GWh/year). $U$ is utilisation and $s$ is the scrap rate; both are dimensionless ratios between 0 and 1.
Assume $U = 1.0$ (assumed value; to be re-checked against field measurements). A 10 GWh line then yields 7.0 GWh of good cells at $s = 0.30$ and 9.0 GWh at $s = 0.10$. On the same equipment, a 2.0 GWh gap comes from the scrap rate alone.
Further reading: Calender Roll Press Line Load Calculation and Crown Design Margin · Slitter Knife Clearance: Standardizing Burr Height · Pressure Deviation in Formation Jigs Is Set by Plate Stiffness
Whatever kind of reader you are, the first question is the same: which cell of the map does this news land in? Decide whether it belongs to materials, equipment, cells, or packs and ESS. Once you find the cell, you can tell whether a number measures factory size, actual output or the flow of money.
Four things to remember
- Materials flow from the materials layer to cells to packs and ESS; equipment supplies the tools that build the cell factory.
- For NMC cells, 40–50% of production cost is cathode material alone (IEA).
- The largest equipment investment in a cell factory is formation: €65–95 million for 10 GWh (PEM·VDMA).
- A new factory’s scrap rate is 15–30% early on and about 10% even after five years (Fraunhofer FFB).
From the next issue, this map will be zoomed in one process at a time, starting from the front. For each step, the series covers what the machine does and what a designer checks first, in the same format. This issue’s map will serve as the guide each time.
Glossary
- Secondary battery: A battery that can be recharged and used many times. The lithium-ion batteries in EVs and phones belong to this group. ↩
- Value chain: The sequence of steps in which value is added as raw materials become finished products. ↩
- Cell: The smallest battery unit that stores and releases electricity. Many cells are bundled into finished products. ↩
- Pack · ESS (Energy Storage System): A pack is a finished product of bundled cells that goes into an EV. An ESS stores electricity and releases it when needed. ↩
- Cathode active material: The powder coated onto the positive electrode. It is the largest share of cell production cost (IEA). ↩
- NMC · LFP: The two main types of cathode material. NMC is based on nickel, manganese and cobalt; LFP is lithium iron phosphate. ↩
- Formation: The process of charging and discharging an assembled cell for the first time to make it usable. ↩
- Scrap rate · yield: The scrap rate is the share of cells made that cannot be sold. Yield is the opposite: the share that can be sold. ↩
- Four key materials: A Korean industry term for cathode material, anode material (the powder coated onto the negative electrode), separator (a thin film that keeps the electrodes apart) and electrolyte (the liquid between the electrodes). ↩
- TWh · GWh: Units of electrical energy. 1 TWh is 1,000 GWh, and 1 GWh is 1 million kWh. ↩
- Roll-to-roll (R2R): A continuous production method in which a thin web is unwound from a roll, processed and wound up again. ↩
- FAT (Factory Acceptance Test): Testing and inspecting equipment at the maker’s plant before it ships. ↩
- Nameplate capacity: The maximum output when all equipment runs as planned. Actual output is lower by the utilisation and the yield. ↩
- Ramp-up: The period after start-up during which a factory raises its output and yield to target. ↩
Sources
- IEA, Global EV Outlook 2026, chapter 6 “Electric vehicle batteries”, 2026-05-20, CC BY 4.0. https://www.iea.org/reports/global-ev-outlook-2026/electric-vehicle-batteries
- PEM of RWTH Aachen University · VDMA, Production Process of a Lithium-Ion Battery Cell, 5th edition, 2026-02, ISBN 978-3-947920-71-6. VDMA download (PDF)
- Fraunhofer FFB, “Experts Develop Criteria for Successful Gigafactory Ramp-up” (release of the white paper “Mastering Ramp-up of Battery Production”), 2024-10-17. https://www.ffb.fraunhofer.de/en/press/news/the-ramp-up-of-a-gigafactory-in-battery-cell-production.html
- Author’s calculations: 1.2 TWh ÷ 70 kWh and 1 GWh ÷ 70 kWh conversions, sum of PEM·VDMA per-process equipment investment ranges (13 pouch-cell processes, buildings excluded), good-output example.
This article is meant to help readers understand the industry and its technology. It is not a recommendation to buy or sell any stock.